Determination of Kinetic Parameters
In general, when a new receptor or radioligand is characterized,
both equilibrium and kinetic techniques are used. In addition, kinetic methods also are used to deal with specific mechanistic
questions.
Dissociation binding data
How "off rate" experiments work?
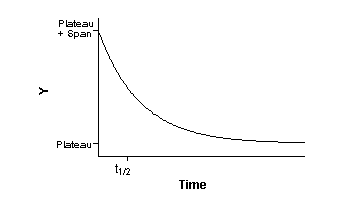
A dissociation binding experiment measures the "off rate" for radioligand
dissociating from the receptor. Initially ligand and receptor are allowed to bind, perhaps to equilibrium. At that point,
you need to block further binding of radioligand to receptor so you can measure the rate of dissociation. There are several
ways to do this:
- If the tissue is attached to a surface, you can remove the buffer
containing radioligand and replace with fresh buffer without radioligand.
- You can spin the suspension and resuspend in fresh buffer.
- Add a very high concentration of an unlabeled ligand. If the concentration
is high enough it will instantly bind to nearly all the unoccupied receptors and thus block binding of the radioligand.
- Dilute the incubation by a large factor, perhaps a 20-fold dilution.
This will reduce the concentration of radioligand by that factor. At such a low concentration, new binding of radioligand
will be negligible. For this method to be useful, you need to use a low radioligand concentration to start with.
You then measure binding at various times after that to determine
how rapidly the ligand falls off the receptors.

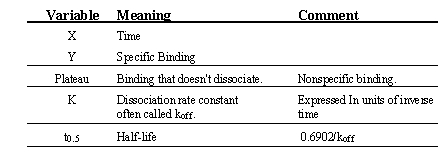
Binding follows this equation:

An analysis of dissociation binding data assumes that the law of
mass action applies to your experimental situation; dissociation binding experiments also let you test that assumption. Ask
yourself these questions:
- Does all the specific binding dissociate? Is the binding truly
reversible?
- Is the dissociation rate constant the same no matter how long you
incubated the cells before initiating dissociation?
- Is the dissociation rate constant the same when you initiate dissociation
by diluting and by adding unlabeled drug? If not, consider the possibility of cooperativity (binding sites are clustered,
and binding of ligand to one binding site changes the affinity of the others).
- After dissociation, is the ligand chemically intact? Or has the
ligand degraded?
Association Binding Data
How "on rate experiments" work
Association binding experiments are used to determine the association
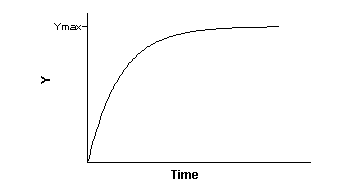
rate constant. You add radioligand and measure specific binding at various times thereafter.

The graph shows you the rate at which the binding approaches equilibrium.
This is determined by four factors:
- The association rate constant, kon or k1.
This is what you are trying to determine.
- The concentration of radioligand. If you use more radioligand,
the system equilibrates faster.
- · The dissociation rate constant, koff or k1.
Some people are surprised to find that the observed rate of association depends in part on the dissociation rate constant.
During the incubation, radioligand is binding to the receptors and radioligand is dissociating from receptors. The system
reaches equilibrium when the two rates are equal. So the observed rate of association measures how long it takes to reach
equilibrium. If the radioligand dissociates quickly from the receptor, equilibrium will be reached faster.
- Temperature affects the values of kon and koff.
The next section explains how to calculate kon from the
rate of equilibration.
| Variable |
Units |
Comments |
 |
 |
The association rate constant (i.e., what you want to know). |
 |
 |
The value determined by fitting an exponential association equation
to your data. |
 |
 |
The dissociation rate constant. See previous section. |
| [radioligand] |
M |
Set by the experimenter. Assumed to be constant during the experiment
(a small fraction binds). |
To determine kon if you don't know koff:
- Perform the association binding experiment at several different
concentrations of radioligand.
- Use nonlinear regression to find kob at each concentration.
- Create a graph with [radioligand] on the X axis and kob on
the Y axis.
- Fit linear regression to this graph. The slope equals kon
and the Y-intercept is koff.
